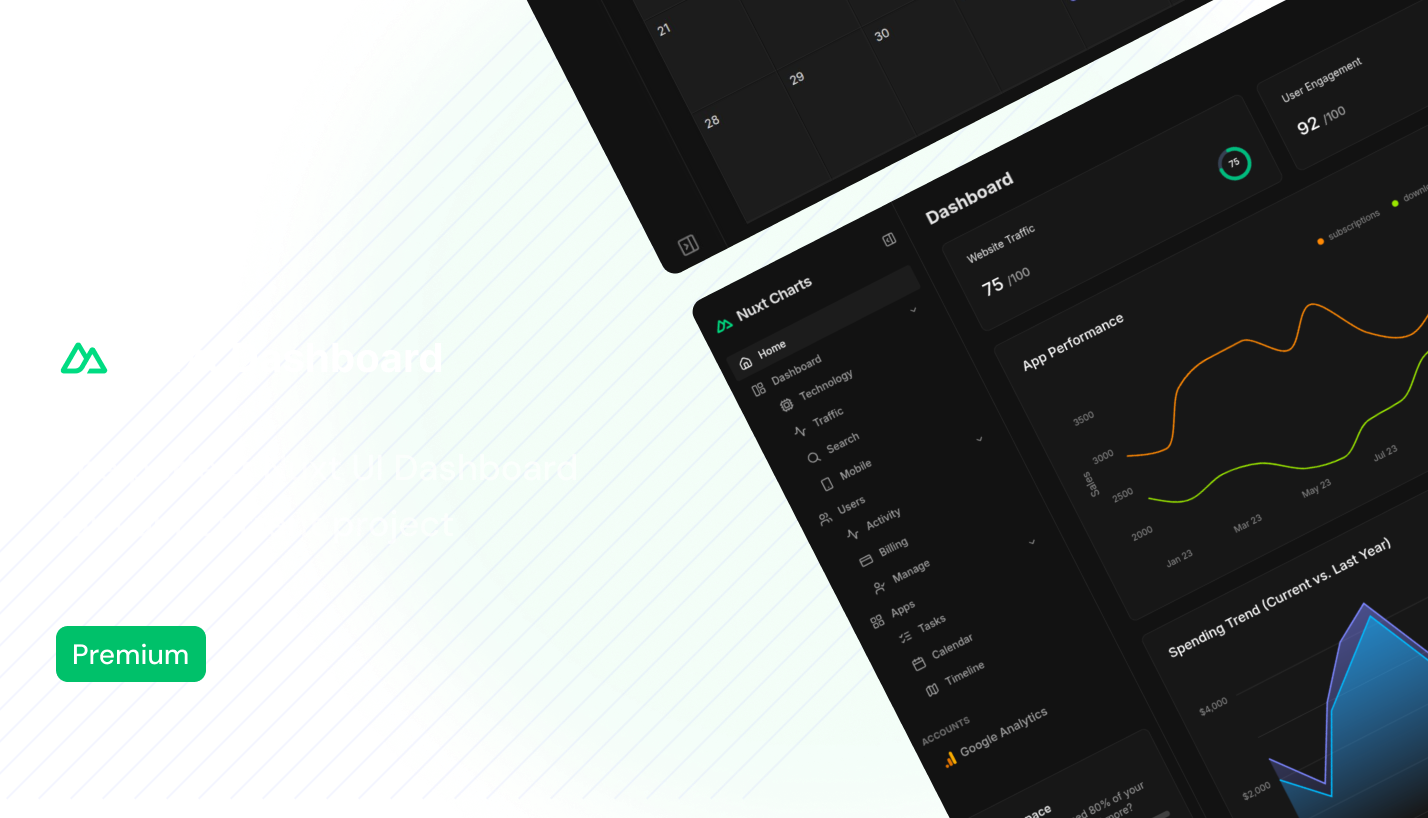
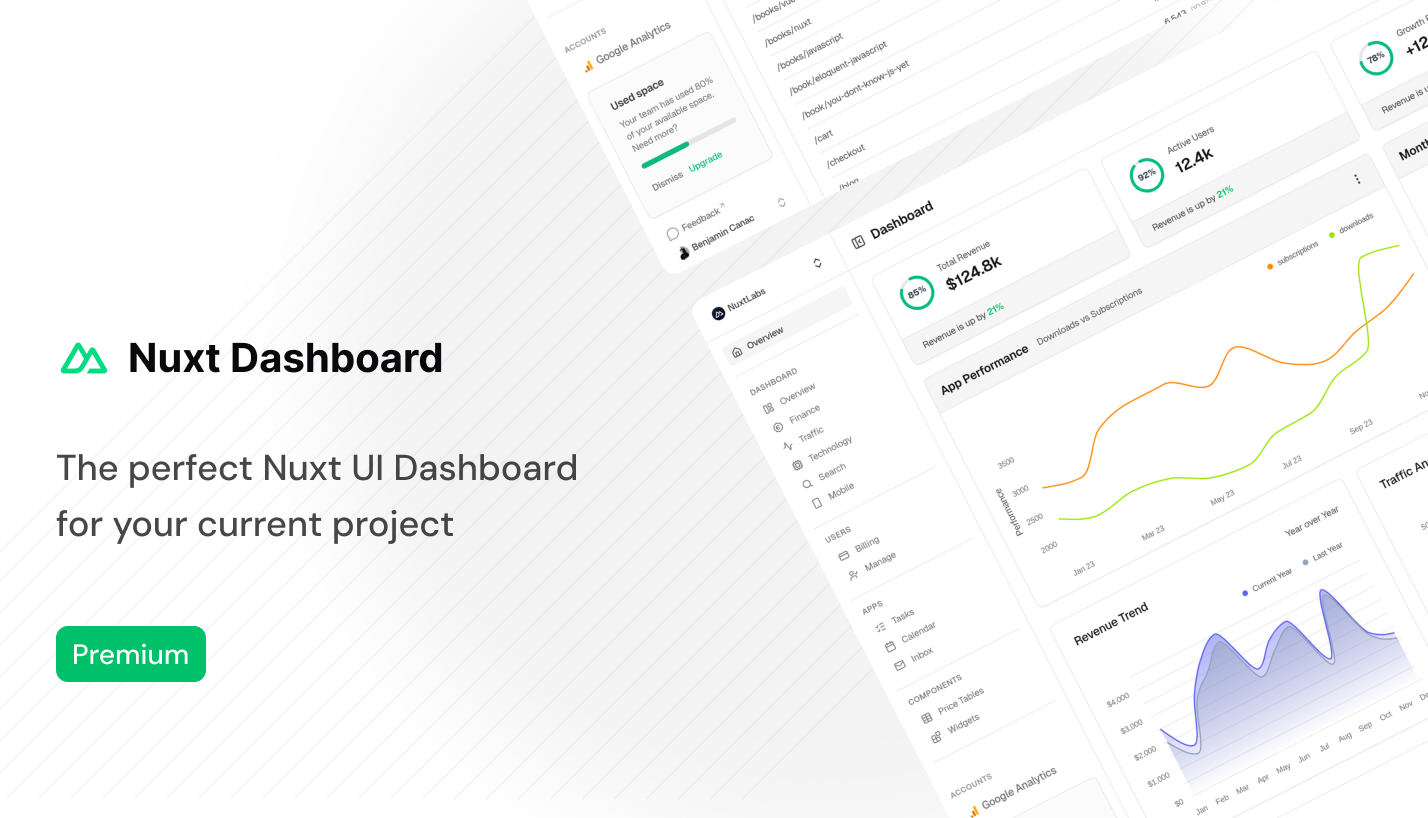
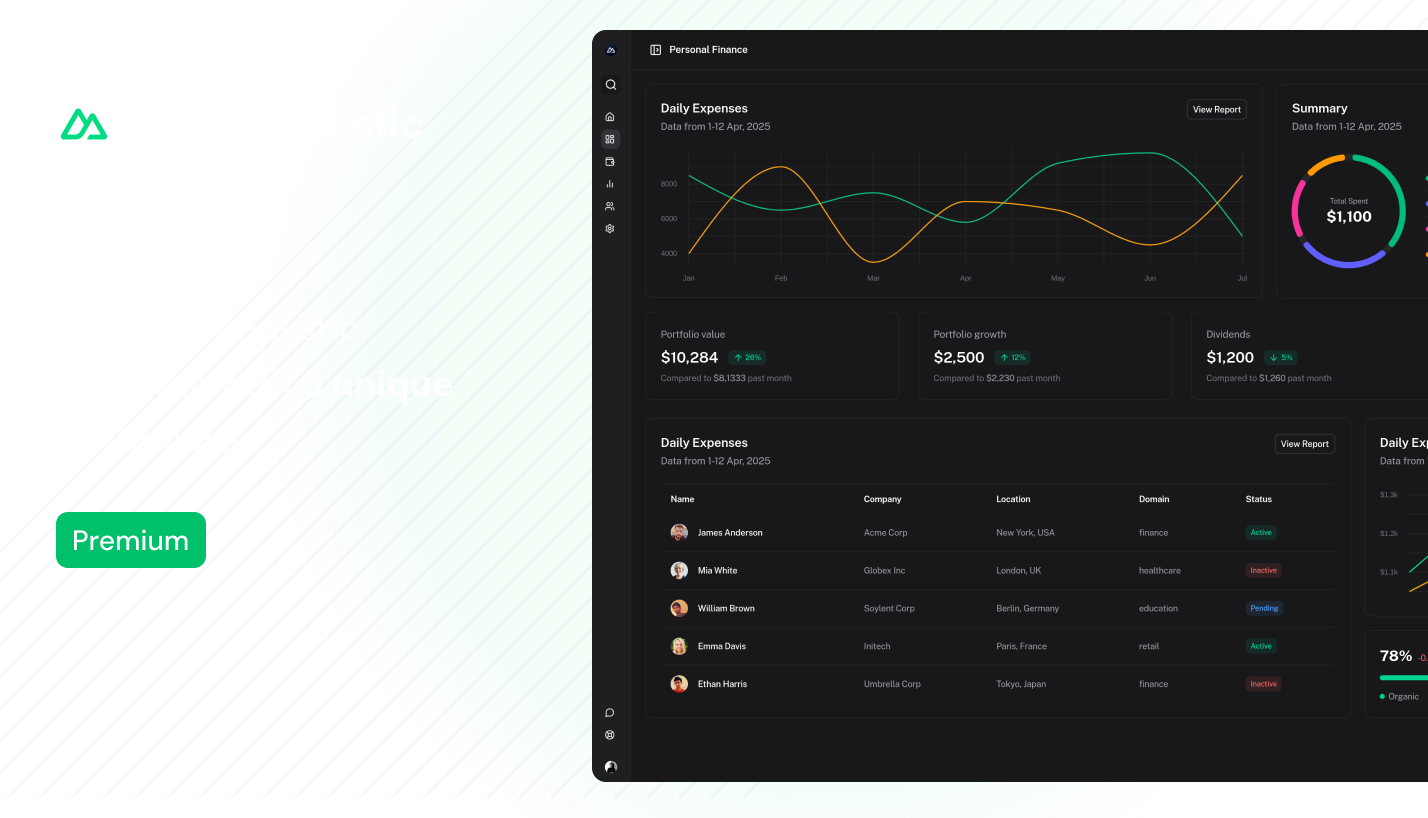
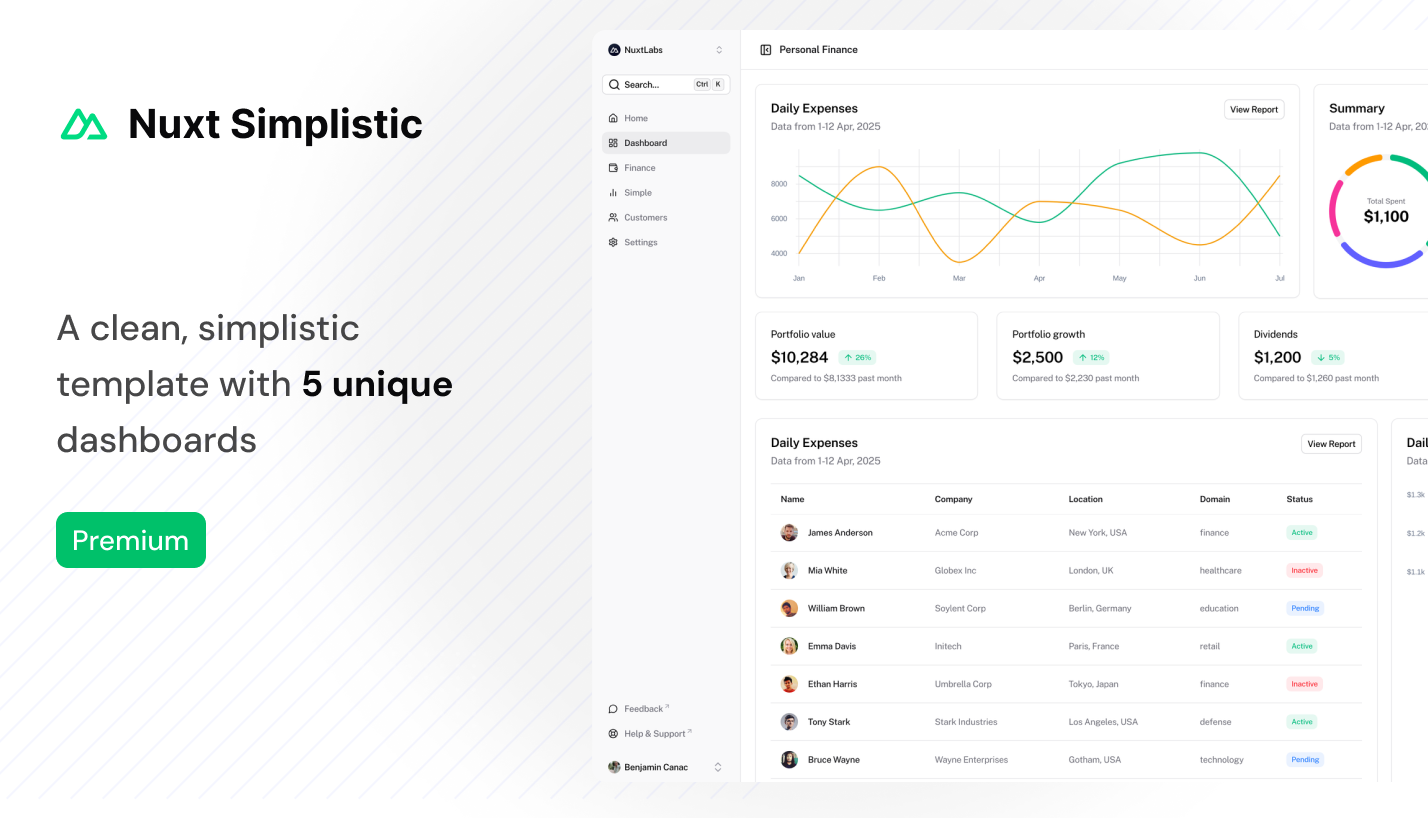
Create beautiful charts with Vue and Nuxt
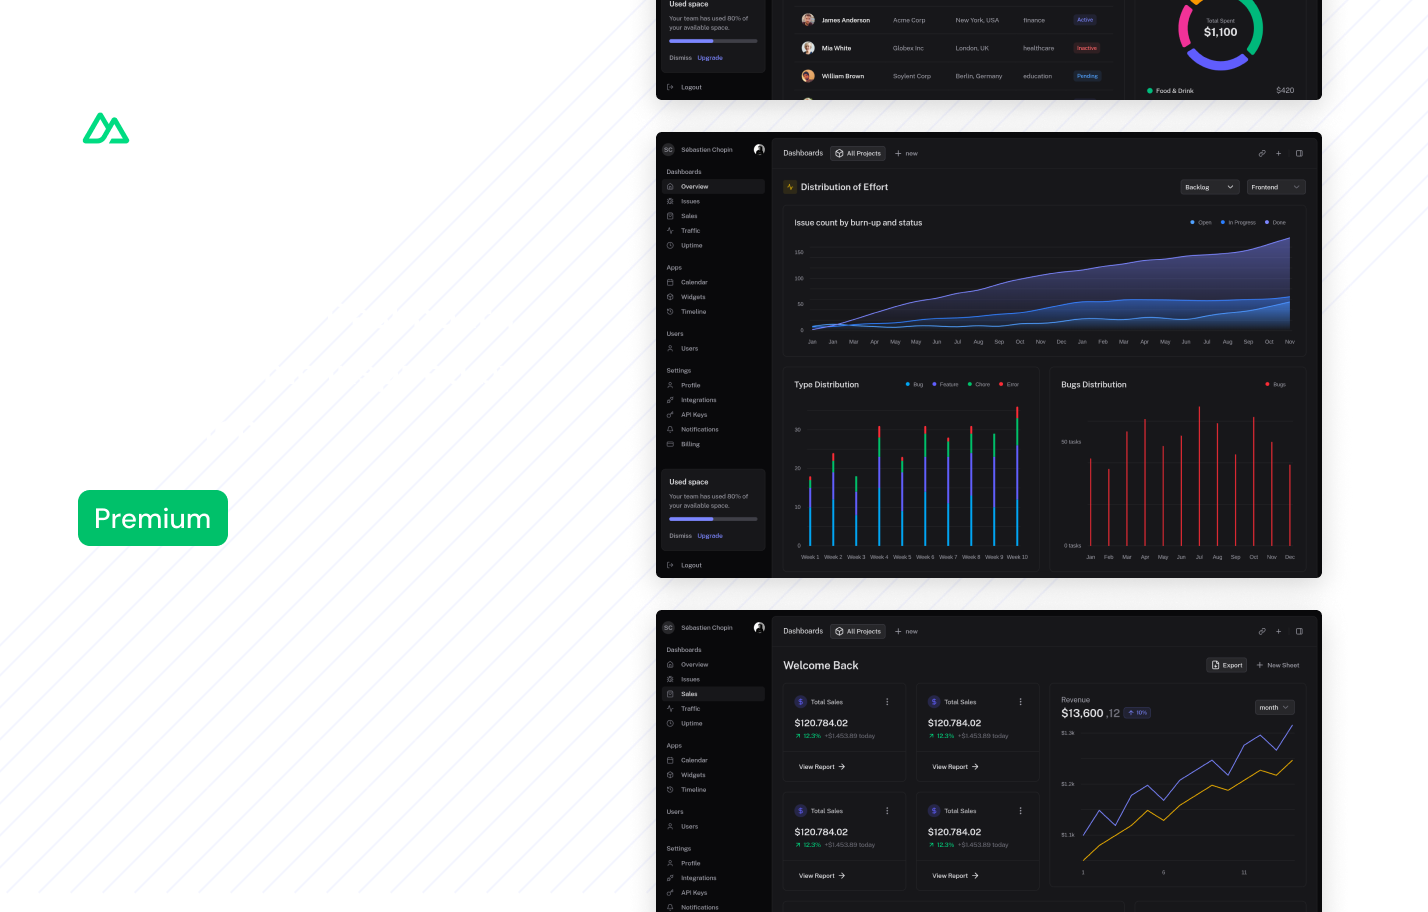
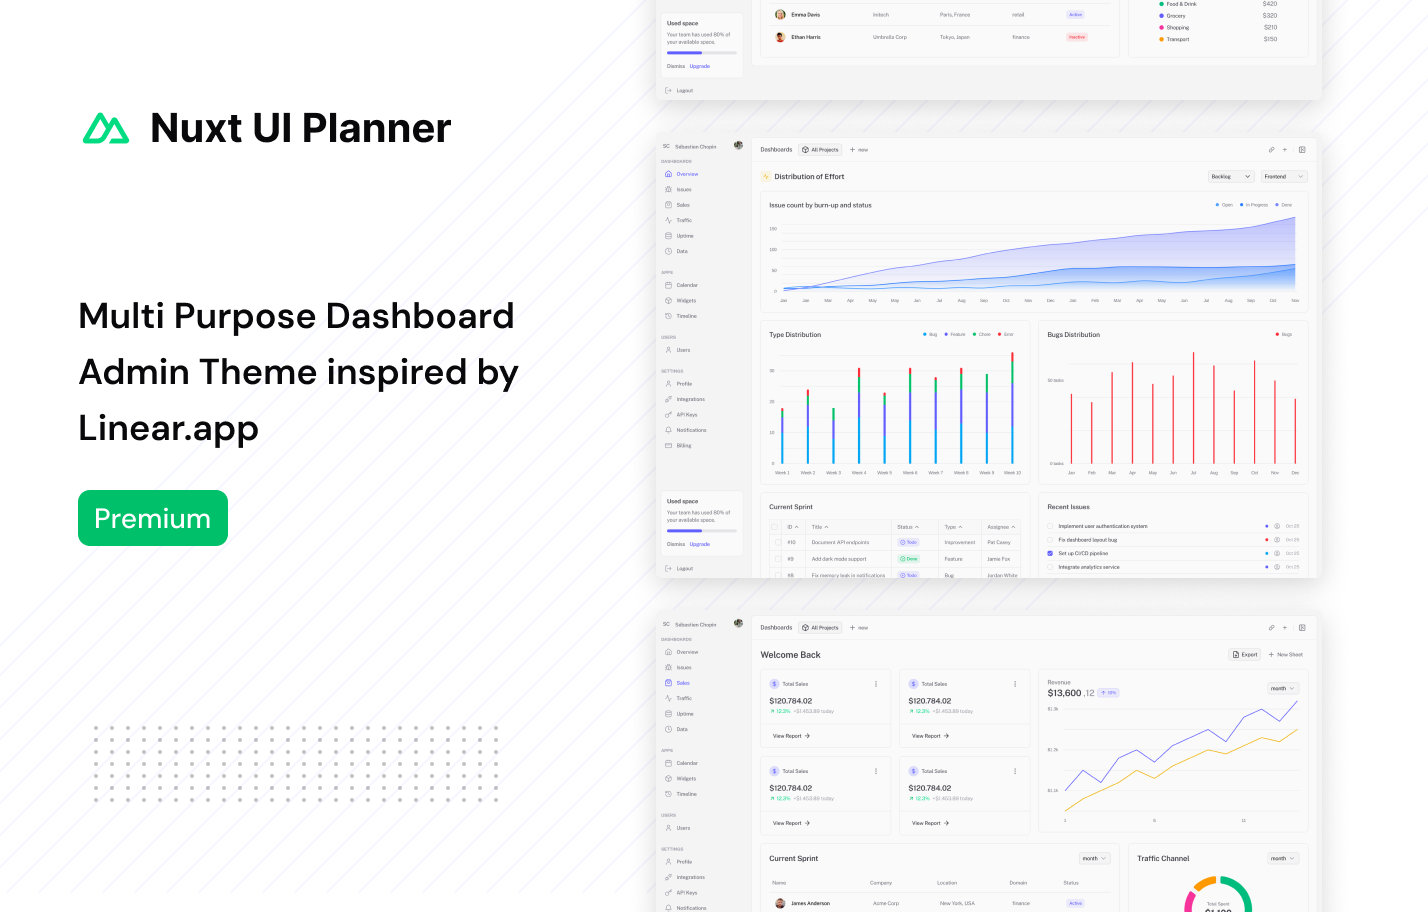
Powerful & intuitive Vue components to build Dashboards & Charts. Built with Tailwind CSS and Nuxt UI.
Line Charts
Visualize trends and changes over time with elegant, interactive line charts—perfect for analytics and reporting.
Explore Line ChartsBar Charts
Compare categories and visualize distributions with interactive bar charts—ideal for summaries and breakdowns.
Explore Bar ChartsArea Charts
Show totals and highlight magnitude with smooth area charts. Great for visualizing stacked data and trends.
Explore Area ChartsDonut Charts
Display proportions and breakdowns with visually engaging donut charts. Ideal for showing parts of a whole.
Explore Donut ChartsTo be part of an amazing ecosystem
Don't Just Take My Word For It...
See What the Others Are Saying
Join Successful Nuxt developers who have chosen Nuxt Charts
I love your work! I use Nuxt for almost all my projects, and your charts are absolutely beautiful. You’ve actually inspired me to start building my own Nuxt module too!
If you need beautiful charts in your Vue or Nuxt app, Nuxt Charts is a no-brainer for me - it's my go-to library for all such use cases!
Nuxt Charts is the simple, beautiful, and customizable charting library the Nuxt/Vue ecosystem was desperately missing.
One of the best chart libraries for the Vue/Nuxt ecosystem. It's customizable, very modular, and its charts look good by default.
The Nuxt charts and dashboards are a breeze to use, it's so easy to implement them into my projects I can spend time on other things because I know I'll always have beautiful components at my disposal!
Had the chance to try NuxtCharts, it makes adding charts to Nuxt projects effortless. Clean, fast, and feels native to the framework 💚
Nuxt Charts is just TOO easy to use and looks beautiful! We've incorporated it into our Nuxt UI course over at Vue School. Its just such an essential addition for any dashboard
I was looking for a quick and easy way to create charts in Nuxt for a homemade dashboard. Nuxt Charts was the obvious choice: incredibly beautiful, great documentation, lots of templates. I feel like I'm going to use it on all my projects 😍
Want to add one? Submit here
Frequently Asked Questions
Everything you need to know about our templates
